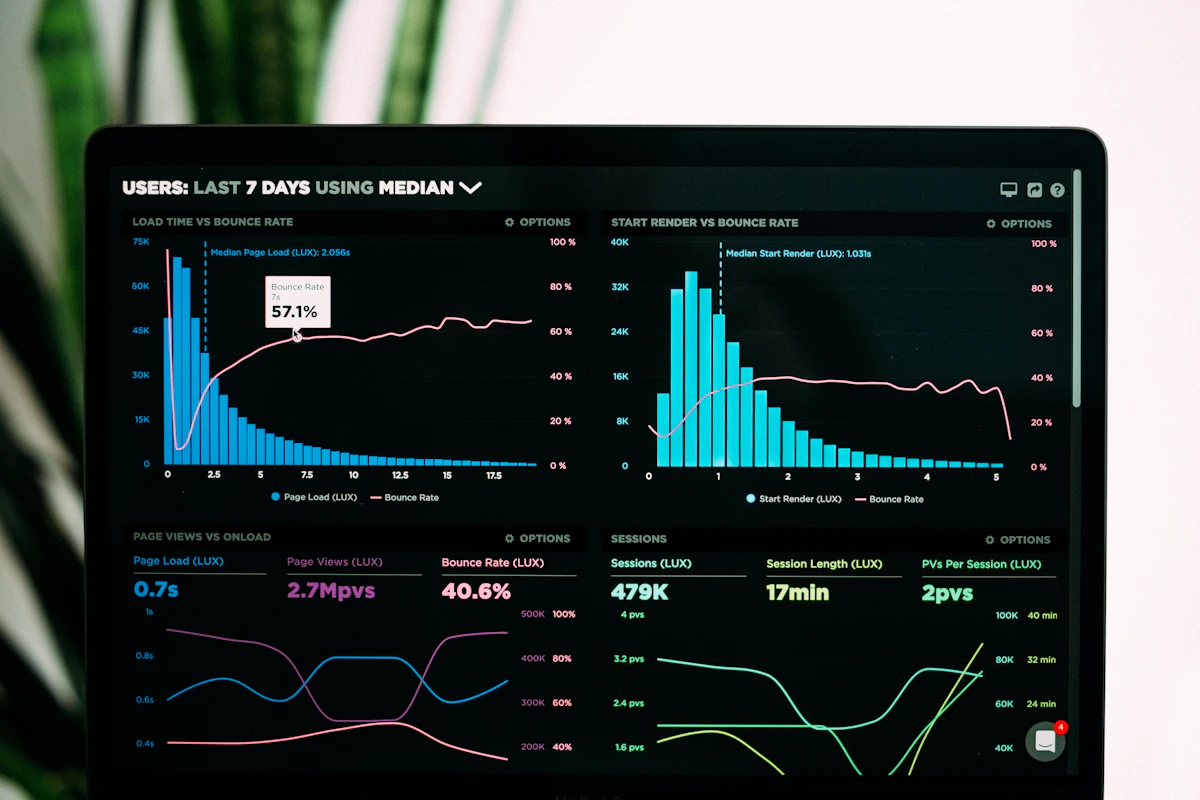
Bottom line: Edithly's API turns learner interactions — the questions students ask, which MCQs they get wrong, which sections they revisit — into analytics that show exactly which concepts are confusing students, before that shows up as a failed exam. One Indian EdTech platform serving 50,000 JEE aspirants used it to lift chapter assessment scores 12% over two academic cycles.
The Analytics Layer Edithly Adds
Most LMS analytics stop at video watch time, quiz scores, login frequency, and content access counts — they don't show which concepts a learner is confused about, what questions they're asking, which sections they keep returning to, or how study patterns correlate with exam performance. When EdTech platforms integrate Edithly's API, every learner interaction with documents generates that second layer of data:
Question Analytics
Every question a learner asks against a document is logged:
- Which document/topic section prompted the question
- The type of question (definition, application, comparison)
- Whether follow-up questions were asked (indicating initial answer was insufficient)
Insight delivered: Topics that generate disproportionate question volume are comprehension bottlenecks. These are the topics where curriculum needs clarification, additional worked examples, or teacher intervention.
MCQ Performance Analytics
Every MCQ generated and attempted:
- Attempt rate by topic (do students skip certain topic quizzes?)
- Accuracy by question type (factual vs application)
- Which distractors are selected most frequently (reveals specific misconceptions)
Insight delivered: Specific misconceptions at scale. If 60% of students select the same wrong answer for a Physics question, the misconception is systematic — and the curriculum needs to address it explicitly.
Visual Generation Analytics
Which visual types do students generate most by subject and topic:
- High flashcard generation → factual, memorisation-heavy topic
- High mind map generation → conceptual, relationship-heavy topic
- High MCQ generation → self-assessment-ready topic
Insight delivered: Subject-level learning style data. Adjust content format and delivery to match how students actually engage with each topic.
Session Pattern Analytics
Time-of-day study patterns, session duration, content revisit frequency:
Insight delivered: At-risk signals. Students who only access content the night before assessments, or who access the same section 5+ times without attempting MCQs, show patterns associated with poor exam outcomes.
Case Study: Indian EdTech Platform
An Indian EdTech platform serving 50,000 JEE aspirants integrated Edithly's API. After 3 months of analytics:
- Identified that Organic Chemistry (Amines chapter) generated 3× the question volume of equivalent Physics chapters → added 2 additional video explanations and a dedicated teacher Q&A session for the chapter
- Discovered that students who generated MCQs from content within 24 hours of first viewing it scored 18% higher on chapter assessments
- Found that 40% of NEET Biology quiz attempts happened between 10 PM and 1 AM → restructured content release schedule for peak study hours
Result: 12% improvement in chapter assessment scores over two academic cycles.
Analytics for Teacher and Tutor Enablement
EdTech platforms aren't just learner-facing. The same analytics inform teacher dashboards:
- Which students are asking the most questions about specific topics (flag for extra attention)
- Cohort-level comprehension gaps (curriculum planning signal)
- Student engagement rank by subject (identify disengaged learners before drop-off)
Teachers stop guessing where to focus remediation and start acting on data.
Building on Edithly's API for EdTech
import edithly

# Get question analytics for a document section
analytics = client.analytics.questions(
    document_id="doc_chapter5",
    date_range="last_30_days"
)

# Questions by topic section
for section in analytics.by_section:
    print(f"{section.name}: {section.question_count} questions, "
          f"{section.avg_followups} avg follow-ups")

# Identify high-confusion sections
confused = [s for s in analytics.by_section if s.avg_followups > 2]
The Outcome: Adaptive Learning at Scale
The end goal of EdTech analytics is adaptive learning — dynamically adjusting content, pacing, and support based on individual learner needs. Edithly's document interaction data provides the signal layer that makes this possible.
Platforms that act on this data see measurable improvements in:
- Course completion rates
- Assessment pass rates
- Learner satisfaction scores
- Renewal and upgrade rates
Integrate Edithly Analytics Into Your EdTech Platform
Access Edithly's API documentation and start building learner analytics into your platform. Available on Pro and Enterprise API plans.

